 Category illustration
Food & nutrition
Look up calories, macronutrients, and more in a source-linked food database. Compare foods on the same 100 g basis.
7,793 food recordsPer 100 g · USDA SR Legacy 2018
Category illustrationCategory illustration Category illustration
Vegetables and Vegetable Products
Vegetables, mixed (corn, lima beans, peas, green beans, carrots) canned, no salt added
37kcal1.4 gProtein7.3 gCarbohydrate
Category illustrationVegetables and Vegetable Products
Vegetables, mixed, canned, drained solids
49kcal2.6 gProtein9.3 gCarbohydrate
Category illustrationVegetables and Vegetable Products
Vegetables, mixed, canned, solids and liquids
36kcal1.4 gProtein7.1 gCarbohydrate
Category illustrationVegetables and Vegetable Products
Vegetables, mixed, frozen, cooked, boiled, drained, with salt
60kcal2.9 gProtein13.1 gCarbohydrate
Category illustrationVegetables and Vegetable Products
Vegetables, mixed, frozen, cooked, boiled, drained, without salt
65kcal2.9 gProtein13.1 gCarbohydrate
Category illustrationVegetables and Vegetable Products
Vegetables, mixed, frozen, unprepared
72kcal3.3 gProtein13.5 gCarbohydrate
 Category illustrationCategory illustrationCategory illustration
Legumes and Legume Products
Veggie burgers or soyburgers, unprepared
177kcal15.7 gProtein14.3 gCarbohydrate
Category illustration Category illustrationCategory illustrationCategory illustrationCategory illustrationCategory illustration
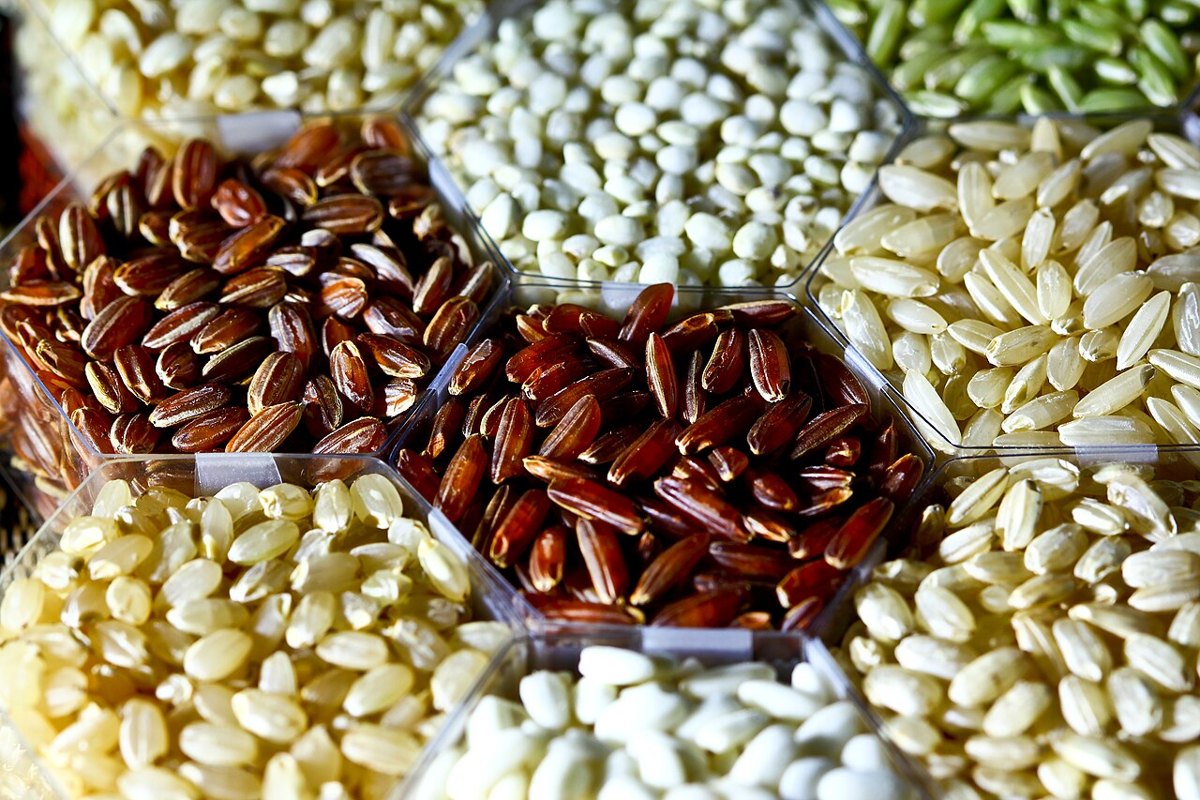 Category illustrationCategory illustrationCategory illustrationCategory illustrationCategory illustrationCategory illustration
Legumes and Legume Products
Vitasoy USA Organic Nasoya Sprouted, Tofu Plus Super Firm
115kcal13.2 gProtein2.2 gCarbohydrate
Category illustrationHistoric source data. Missing values are shown as unavailable, not zero. Category photo — illustrative, not this exact food.