 Category illustration
Food & nutrition
Look up calories, macronutrients, and more in a source-linked food database. Compare foods on the same 100 g basis.
7,793 food recordsPer 100 g · USDA SR Legacy 2018
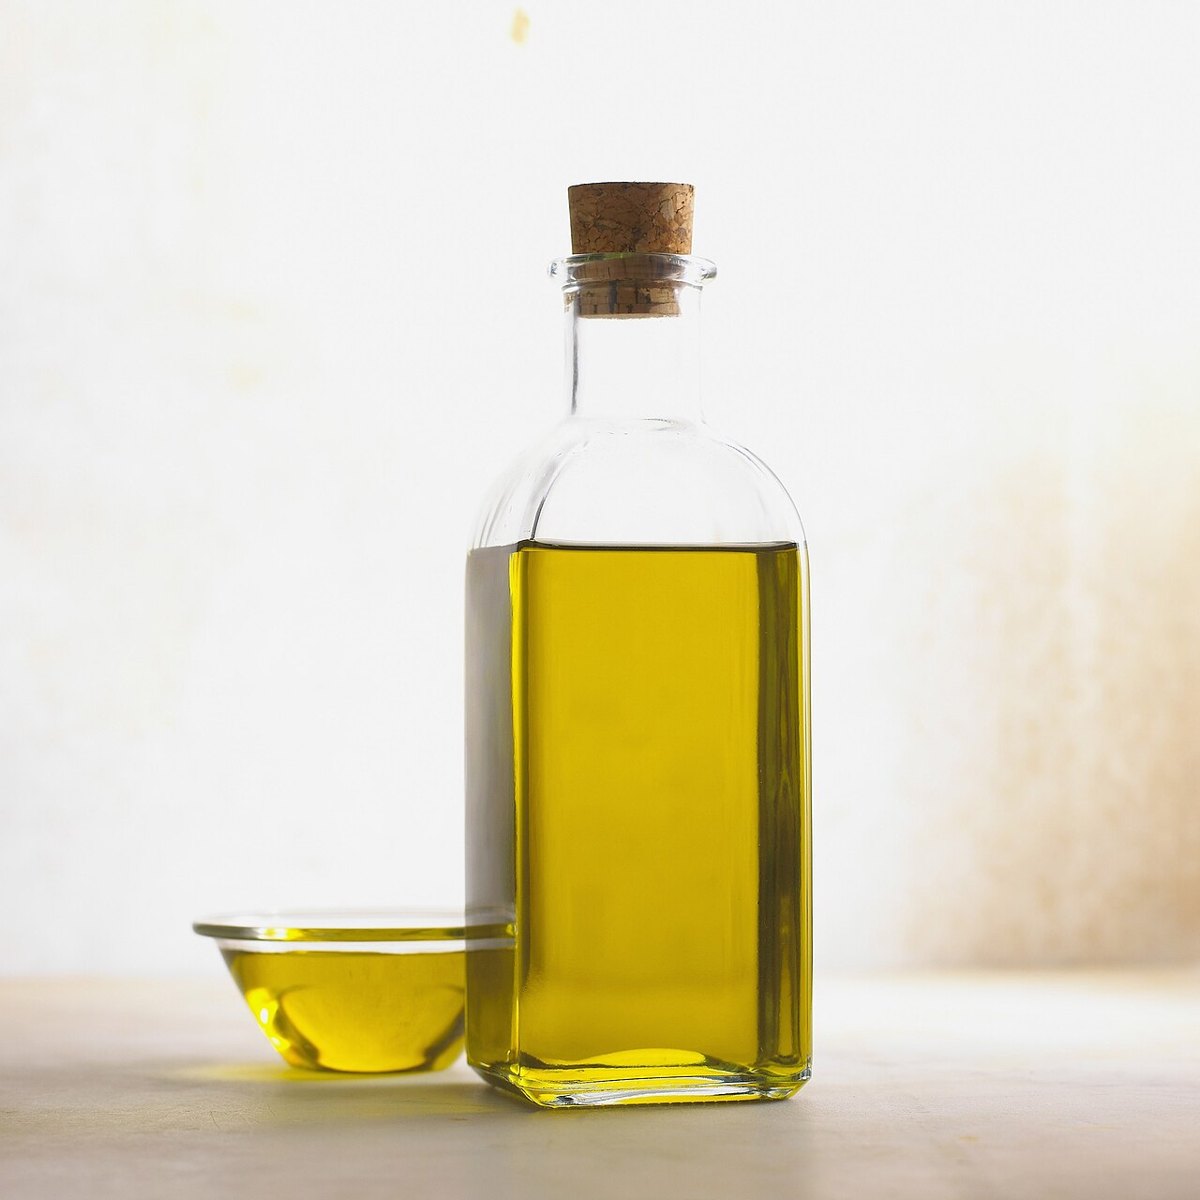
Category illustrationCategory illustrationFats and Oils
Margarine-like, vegetable oil spread, stick or tub, sweetened
534kcal0 gProtein16.7 gCarbohydrate
Category illustrationFats and Oils
Margarine-like, vegetable oil-butter spread, reduced calorie, tub, with salt
450kcal1 gProtein1 gCarbohydrate
Category illustrationFats and Oils
Margarine-like, vegetable oil-butter spread, tub, with salt
362kcal1 gProtein1 gCarbohydrate
 Category illustration
 Category illustration
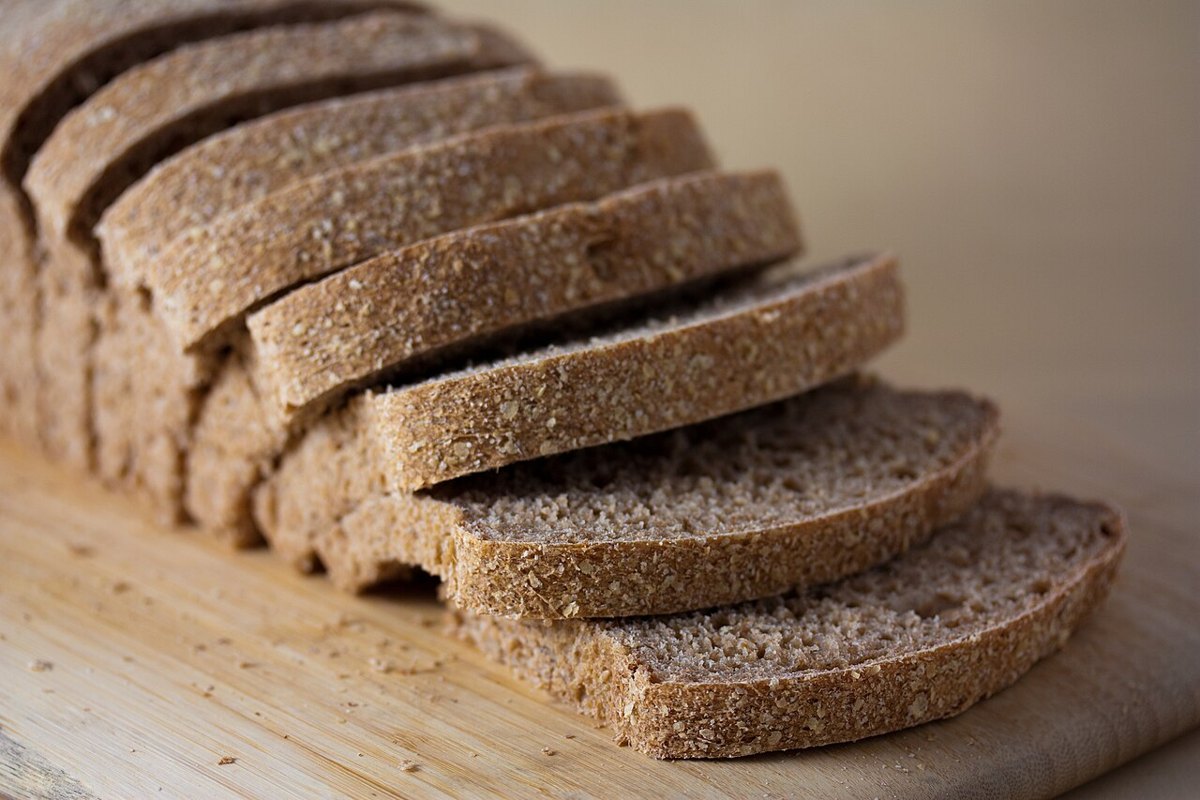
Baked Products
Martha White Foods, Martha White's Buttermilk Biscuit Mix, dry
388kcal7.8 gProtein59.4 gCarbohydrate
Category illustrationBaked Products
Martha White Foods, Martha White's Chewy Fudge Brownie Mix, dry
407kcal4.4 gProtein83.6 gCarbohydrate
Category illustrationBaked Products
Mary's Gone Crackers, Original Crackers, Organic Gluten Free
446kcal12.1 gProtein64.3 gCarbohydrate
 Category illustration
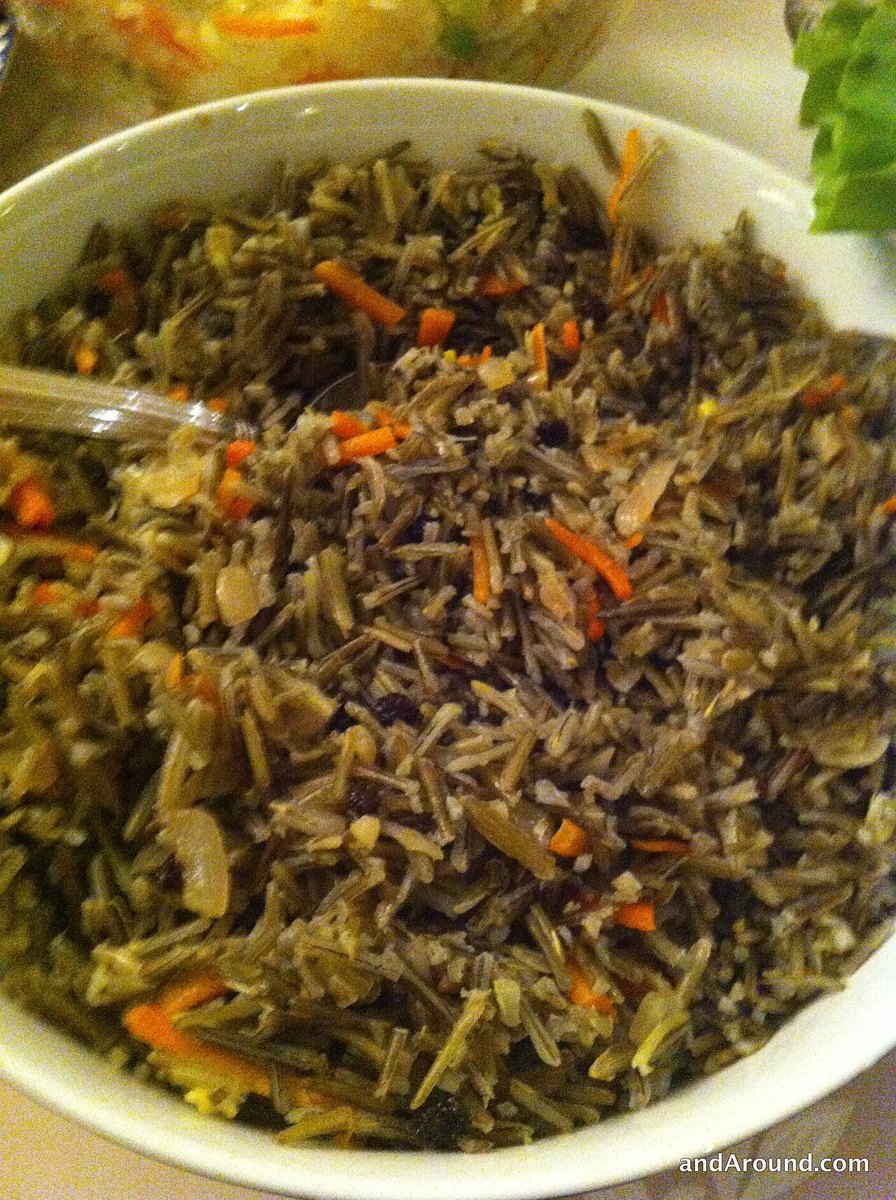
American Indian/Alaska Native Foods
Mashu roots, raw (Alaska Native)
135kcal5.8 gProtein22.6 gCarbohydrate
Category illustrationCategory illustrationCategory illustrationCategory illustrationCategory illustrationFats and Oils
Mayonnaise, reduced-calorie or diet, cholesterol-free
333kcal0.9 gProtein6.7 gCarbohydrate
 Category illustrationCategory illustrationCategory illustrationCategory illustrationCategory illustrationCategory illustrationCategory illustrationCategory illustrationCategory illustrationCategory illustration
Historic source data. Missing values are shown as unavailable, not zero. Category photo — illustrative, not this exact food.