 Category illustration
Żywność i wartości odżywcze
Sprawdzaj kalorie, makroskładniki i inne wartości w bazie żywności z odnośnikami do źródeł. Porównuj produkty na tej samej podstawie — na 100 g.
7,793 pozycji w bazie żywnościNa 100 g · USDA SR Legacy 2018
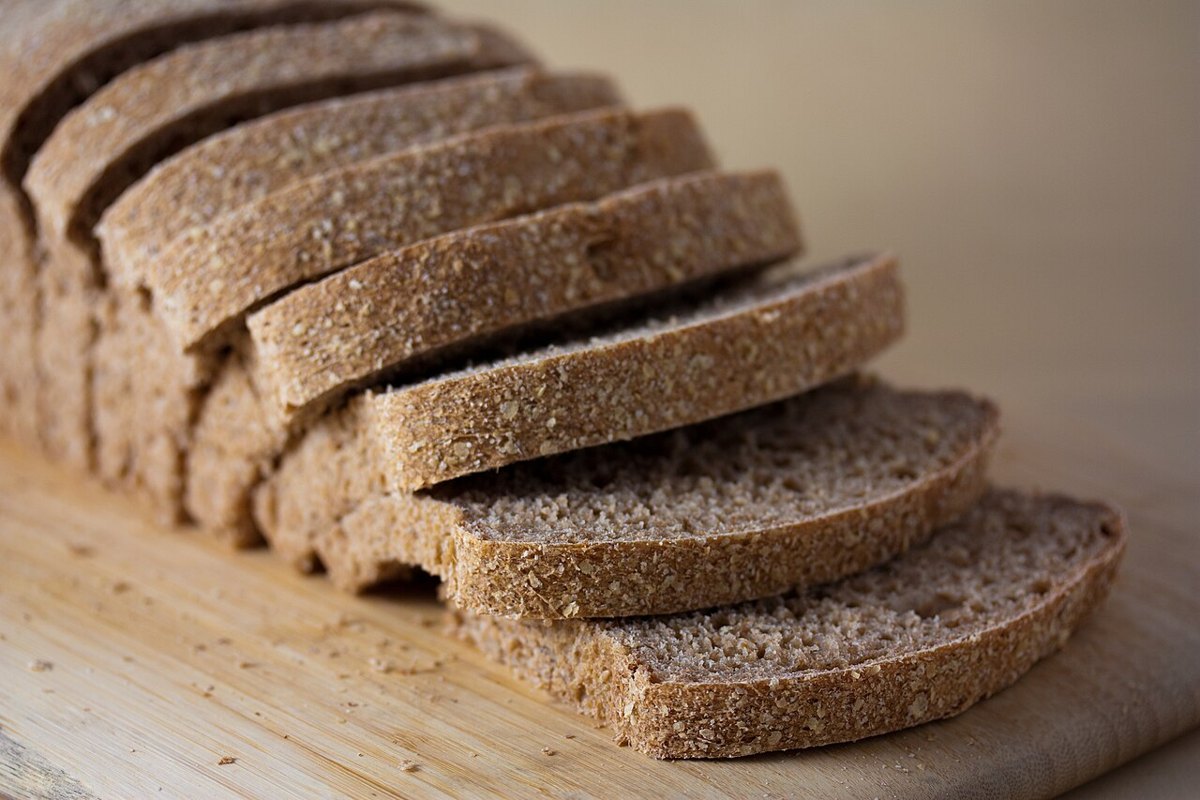
Category illustrationCategory illustrationCategory illustrationCategory illustrationCategory illustrationCategory illustrationCategory illustrationCategory illustrationCategory illustrationCategory illustrationCategory illustrationBaked Products
Bread, white, commercially prepared (includes soft bread crumbs)
266kcal8.9 gBiałko49.4 gWęglowodany
Category illustrationBaked Products
Bread, white, commercially prepared, low sodium, no salt
267kcal8.2 gBiałko49.6 gWęglowodany
Category illustrationCategory illustrationBaked Products
Bread, white, commercially prepared, toasted, low sodium no salt
293kcal9 gBiałko54.4 gWęglowodany
Category illustrationBaked Products
Bread, white, prepared from recipe, made with low fat (2%) milk
285kcal7.9 gBiałko49.6 gWęglowodany
Category illustrationBaked Products
Bread, white, prepared from recipe, made with nonfat dry milk
274kcal7.7 gBiałko53.6 gWęglowodany
Category illustrationCategory illustrationBaked Products
Bread, whole-wheat, commercially prepared, toasted
306kcal16.3 gBiałko51.2 gWęglowodany
Category illustrationCategory illustration Category illustration
 Category illustrationCategory illustration
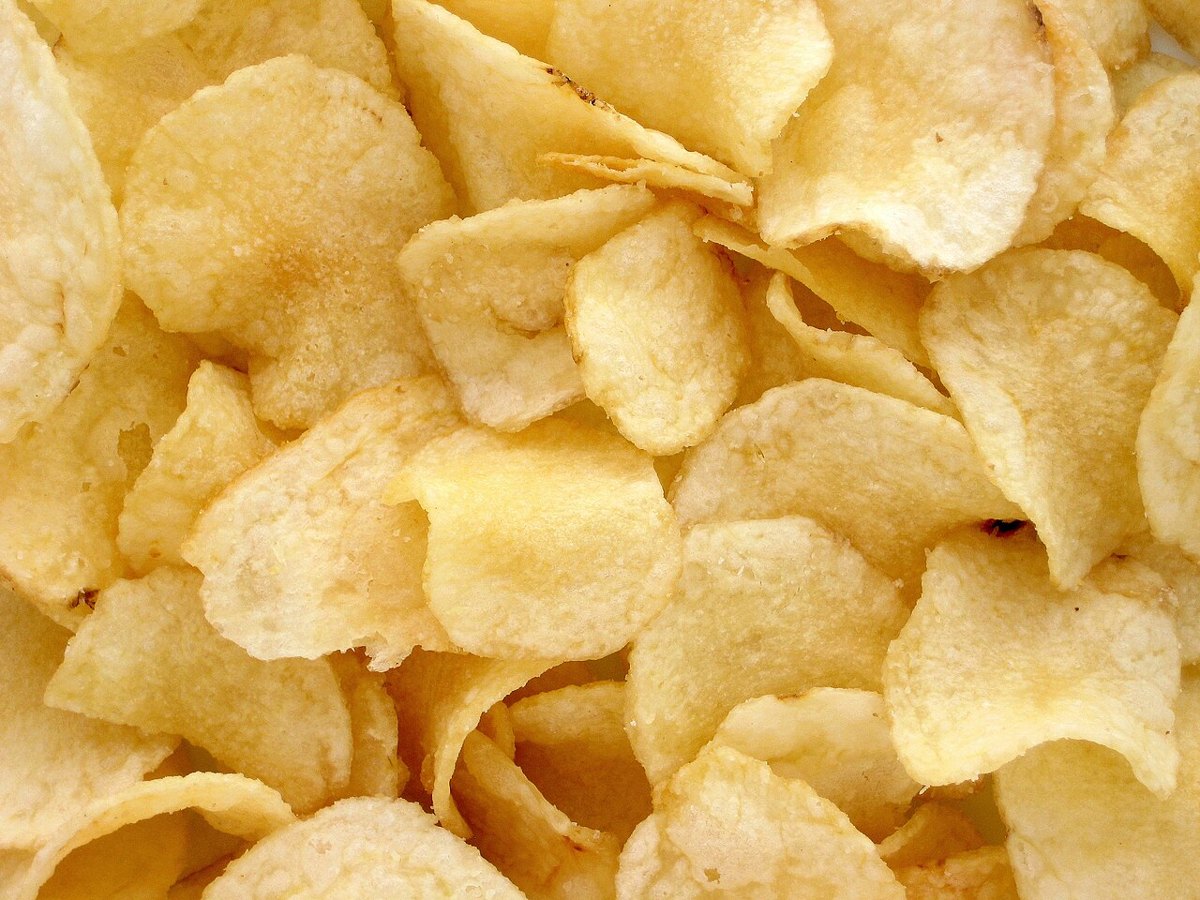
Snacks
Breakfast bars, oats, sugar, raisins, coconut (include granola bar)
464kcal9.8 gBiałko66.7 gWęglowodany
 Category illustration
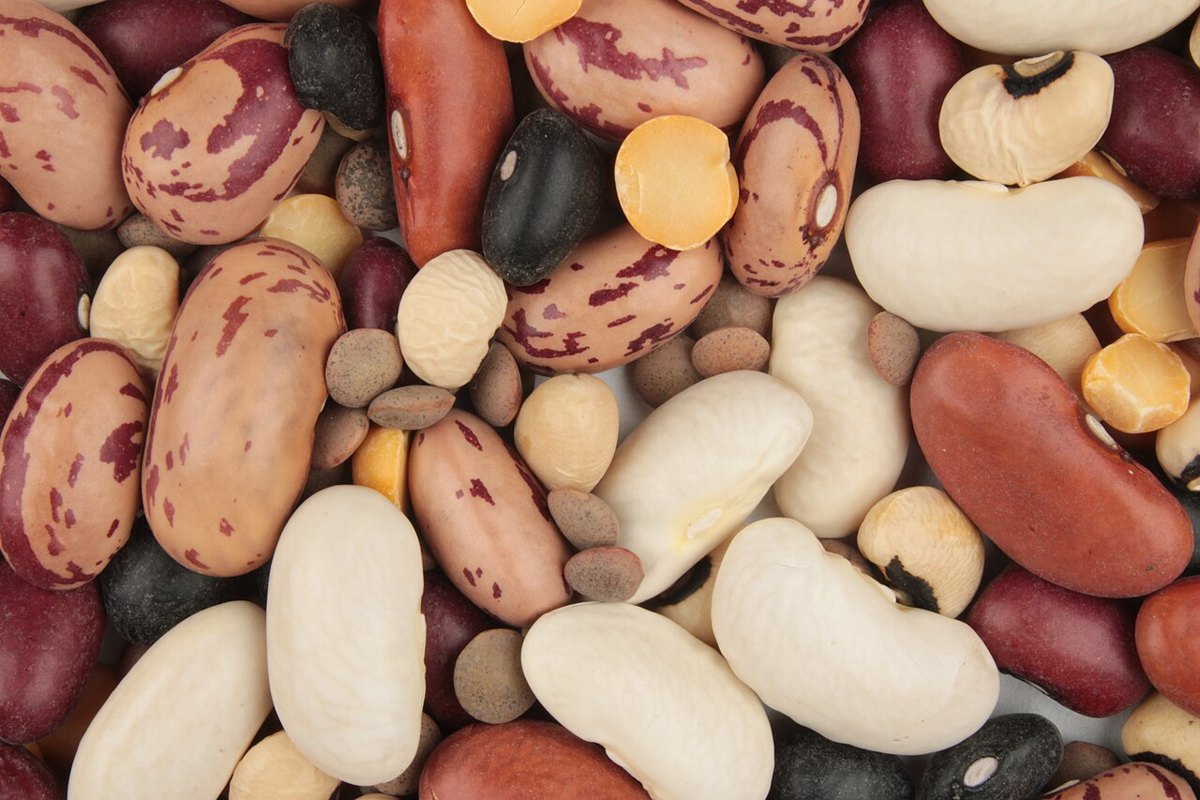
Legumes and Legume Products
Broadbeans (fava beans), mature seeds, canned
71kcal5.5 gBiałko12.4 gWęglowodany
Historyczne dane źródłowe. Brakujące wartości oznaczono jako niedostępne, a nie jako zero. Zdjęcie kategorii jest poglądowe i nie przedstawia dokładnie tego produktu.