 Category illustration
Food & nutrition
Look up calories, macronutrients, and more in a source-linked food database. Compare foods on the same 100 g basis.
7,793 food recordsPer 100 g · USDA SR Legacy 2018
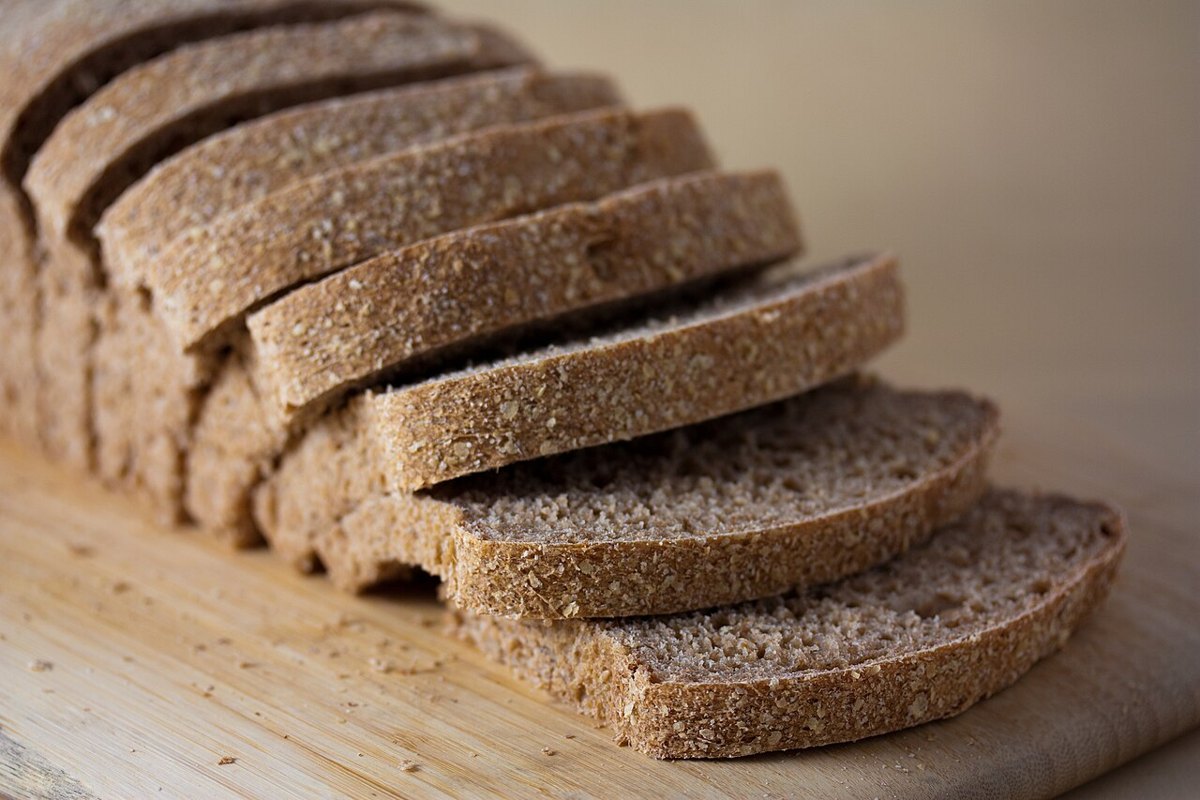
Category illustrationCategory illustrationCategory illustrationCategory illustrationCategory illustrationCategory illustrationCategory illustrationCategory illustrationCategory illustrationCategory illustrationCategory illustrationBaked Products
Bread, white, commercially prepared (includes soft bread crumbs)
266kcal8.9 gProtein49.4 gCarbohydrate
Category illustrationBaked Products
Bread, white, commercially prepared, low sodium, no salt
267kcal8.2 gProtein49.6 gCarbohydrate
Category illustrationCategory illustrationBaked Products
Bread, white, commercially prepared, toasted, low sodium no salt
293kcal9 gProtein54.4 gCarbohydrate
Category illustrationBaked Products
Bread, white, prepared from recipe, made with low fat (2%) milk
285kcal7.9 gProtein49.6 gCarbohydrate
Category illustrationBaked Products
Bread, white, prepared from recipe, made with nonfat dry milk
274kcal7.7 gProtein53.6 gCarbohydrate
Category illustrationCategory illustrationBaked Products
Bread, whole-wheat, commercially prepared, toasted
306kcal16.3 gProtein51.2 gCarbohydrate
Category illustrationCategory illustrationBaked Products
Bread, whole-wheat, prepared from recipe, toasted
305kcal9.2 gProtein56.4 gCarbohydrate
 Category illustration
 Category illustrationCategory illustration
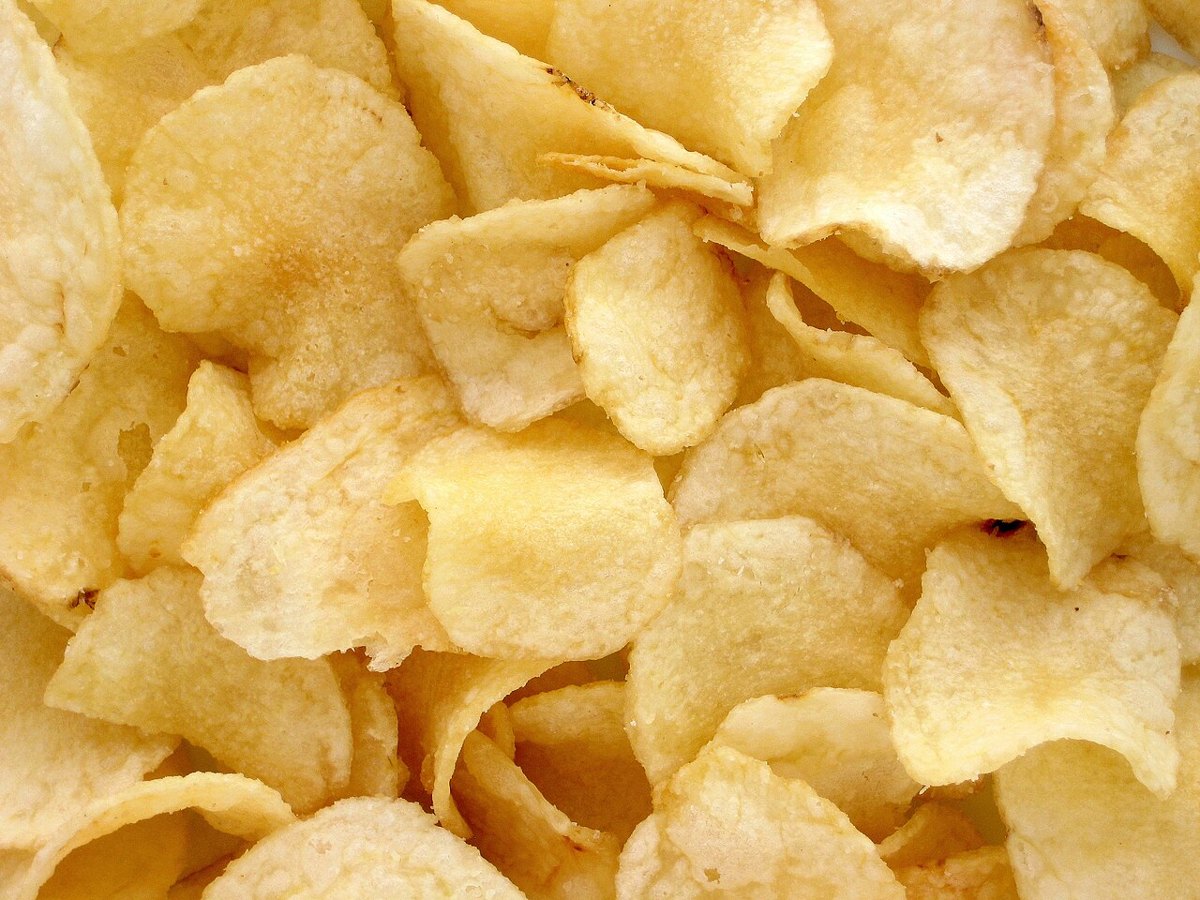
Snacks
Breakfast bars, oats, sugar, raisins, coconut (include granola bar)
464kcal9.8 gProtein66.7 gCarbohydrate
 Category illustration
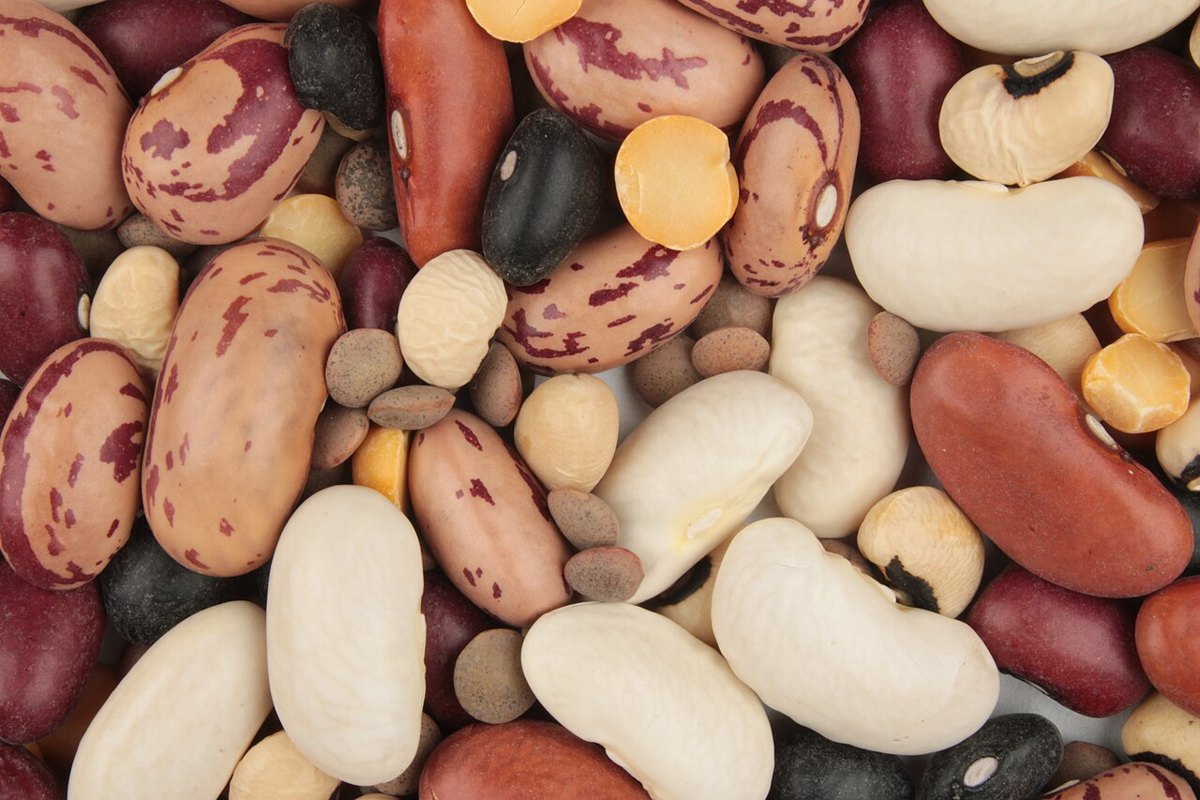
Legumes and Legume Products
Broadbeans (fava beans), mature seeds, canned
71kcal5.5 gProtein12.4 gCarbohydrate
Historic source data. Missing values are shown as unavailable, not zero. Category photo — illustrative, not this exact food.