 Category illustration
Lebensmittel & Nährwerte
Schlage Kalorien, Hauptnährstoffe und mehr in einer Lebensmitteldatenbank mit Quellenangaben nach. Vergleiche Lebensmittel auf derselben Basis von 100 g.
7,793 LebensmitteleinträgePro 100 g · USDA SR Legacy 2018
Category illustrationCategory illustrationCategory illustrationCategory illustration Category illustration
American Indian/Alaska Native Foods
Raspberries, wild (Northern Plains Indians)
62kcal1.1 gEiweiß13.9 gKohlenhydrate
Category illustration Category illustration
Meals, Entrees, and Side Dishes
Ravioli, cheese with tomato sauce, frozen, not prepared, includes regular and light entrees
111kcal4.5 gEiweiß17.3 gKohlenhydrate
Category illustrationCategory illustrationMeals, Entrees, and Side Dishes
Ravioli, meat-filled, with tomato sauce or meat sauce, canned
97kcal3.2 gEiweiß13.3 gKohlenhydrate
 Category illustration
 Category illustrationCategory illustration
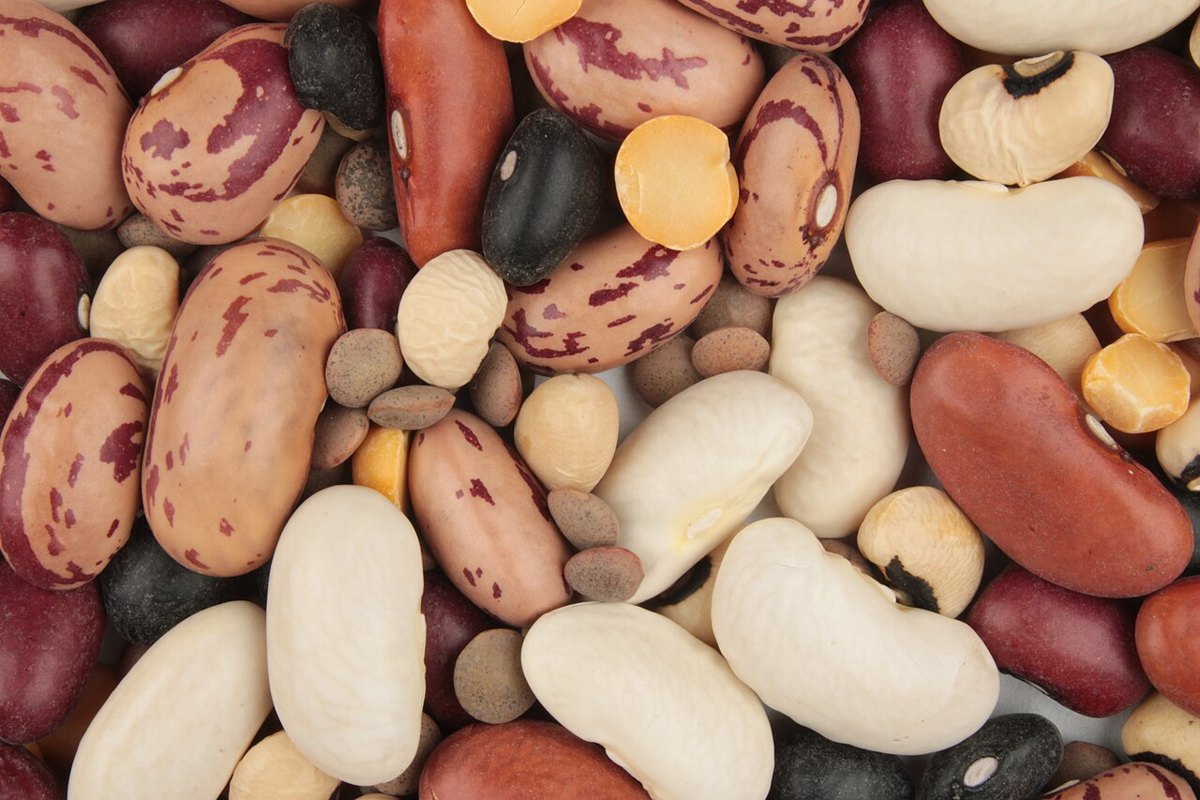
Legumes and Legume Products
Refried beans, canned, traditional style
90kcal5 gEiweiß13.6 gKohlenhydrate
Category illustrationLegumes and Legume Products
Refried beans, canned, traditional, reduced sodium
89kcal5 gEiweiß13.6 gKohlenhydrate
Category illustration Category illustrationCategory illustrationCategory illustrationCategory illustration
 Category illustrationCategory illustrationCategory illustrationCategory illustrationCategory illustrationCategory illustration
Historische Quelldaten. Fehlende Werte werden als nicht verfügbar angezeigt, nicht als 0. Kategoriefoto zur Veranschaulichung, nicht dieses konkrete Lebensmittel.